What You Will Learn
Oracle Analytics Cloud — From Dashboards to Decisions
Oracle Analytics Cloud empowers organizations with modern, AI-powered analytics — delivering dynamic visualizations, interactive dashboards, and real-time insights at enterprise scale. Building on that foundation, OAC now introduces the Agentic User Experience, redefining analytics as a conversational, intelligent, and always-available decision platform.
For years, business intelligence followed a familiar routine: dashboards were built, reports were published, and insights depended on someone finding and interpreting them correctly. Analysts became intermediaries — translating data into explanations rather than driving outcomes. That approach no longer keeps pace with how decisions are made today.
This guide shows you what changes when the analytics experience itself becomes agentic — when every user can ask, explore, and act in plain language, guided by your own business rules.
Before This Guide
- “Can someone pull last quarter’s numbers?”
- Days waiting for an analyst to build a report
- Insights arrive too late to act on
- Only power users can explore data
After This Guide
- “I already have the answer.”
- Ask questions → get charts instantly
- One prompt → a full dashboard
- AI Agent that knows your business rules
✨ Workbook AI Assistant
Ask questions in natural language directly inside any workbook. The AI creates and modifies visualizations, surfaces trends, and lets you iteratively refine charts — just by talking to it. Save insights to workbooks or your Watchlist instantly.
🏠 Homepage AI Assistant
Build a complete dashboard from a single prompt — no workbook setup needed. Context-aware dialogue retains your intent across follow-ups, and smart search combines catalog discovery with semantic understanding.
Go beyond generic answers. AI Agents blend your datasets with uploaded policy documents, apply your business rules and KPI definitions, and explain trends with organizational context. Your analytics co-pilot, speaking your company’s language.
| Role | What You Will Be Able to Do | Hands-On Activities |
|---|---|---|
Analyst, workbook designer |
Build and deploy a complete AI-powered analytics experience — from raw data to a conversational interface your team can use on day one | Upload data, configure indexing & synonyms, test AI prompts, create an AI Agent with business rules and RAG knowledge documents, then publish for consumers |
| Consumer Business user, decision maker |
Get instant, trustworthy answers by typing questions in everyday language — no training, no SQL, no dependencies | Open a shared workbook, ask questions through the AI Assistant, interact with AI Agents that know your business context, and save insights to your Watchlist |
| Admin Platform or security owner |
Ensure the environment is ready so your team can hit the ground running | Verify GenAI service settings, confirm application roles, and enable the Use Assistant in Workbooks permission |
🔧
Admin Pre-Check~10 min
Admin Pre-Check~10 min
This section is for administrators. It covers the GenAI console settings (which come pre-configured) and the steps to create a consumer role with AI Assistant permissions. These steps are typically completed before anyone begins the hands-on labs.
What you will achieve in this lab
Verify GenAI service settings, application roles, and the Use Assistant in Workbooks permission so the hands-on labs run smoothly.
Verify Generative AI Settings (Pre-Configured)
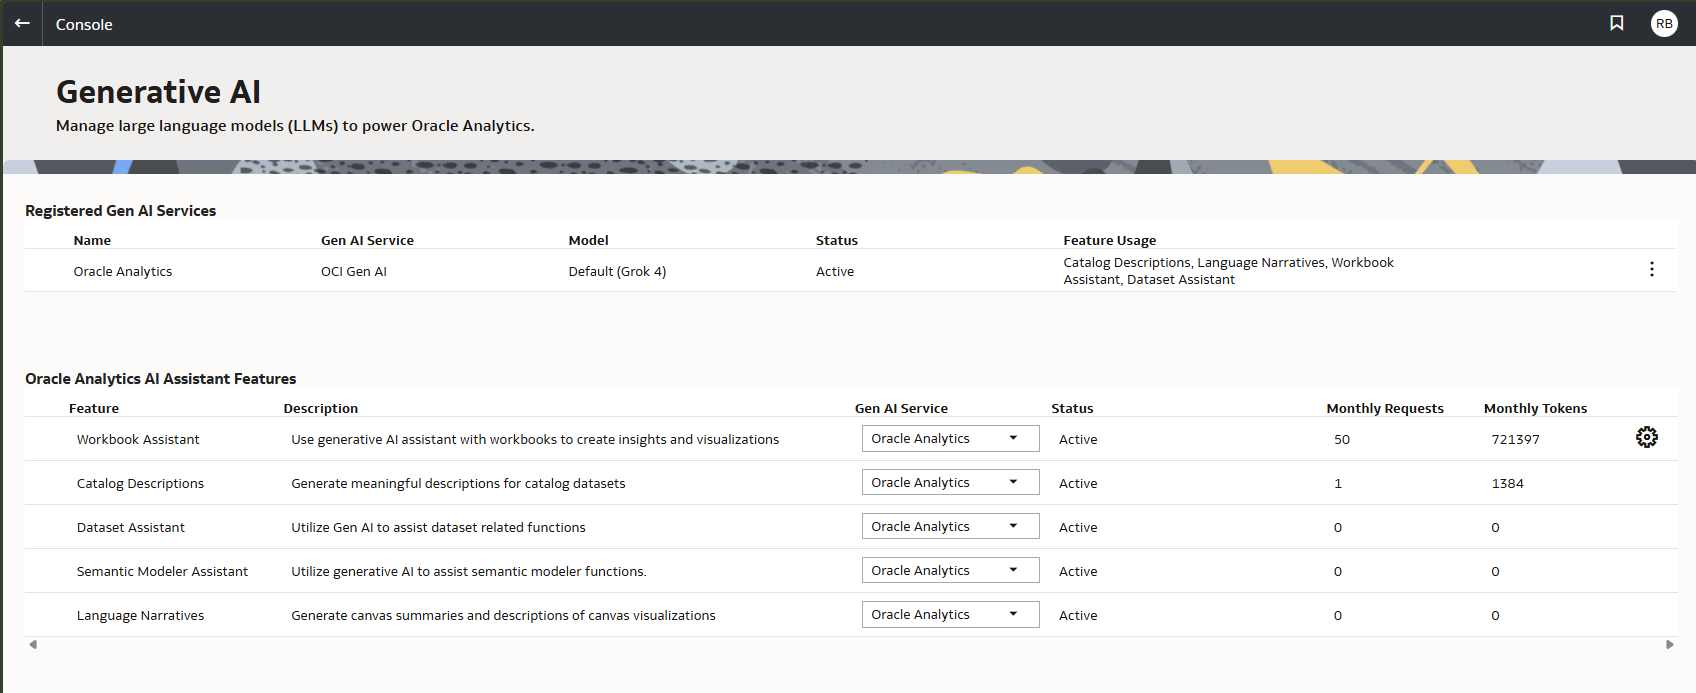
The Generative AI page comes pre-configured and active by default. No action is needed, but it is useful to verify what is available and which LLM model is in use.
- Navigate to (under Extensions and Enrichments)
- You will see two sections:
- Registered Gen AI Services — shows the Oracle Analytics service. The Model column shows which LLM is active.
- Oracle Analytics AI Assistant Features — five features, all active by default: Workbook Assistant, Catalog Descriptions, Dataset Assistant, Semantic Modeler Assistant, Language Narratives.
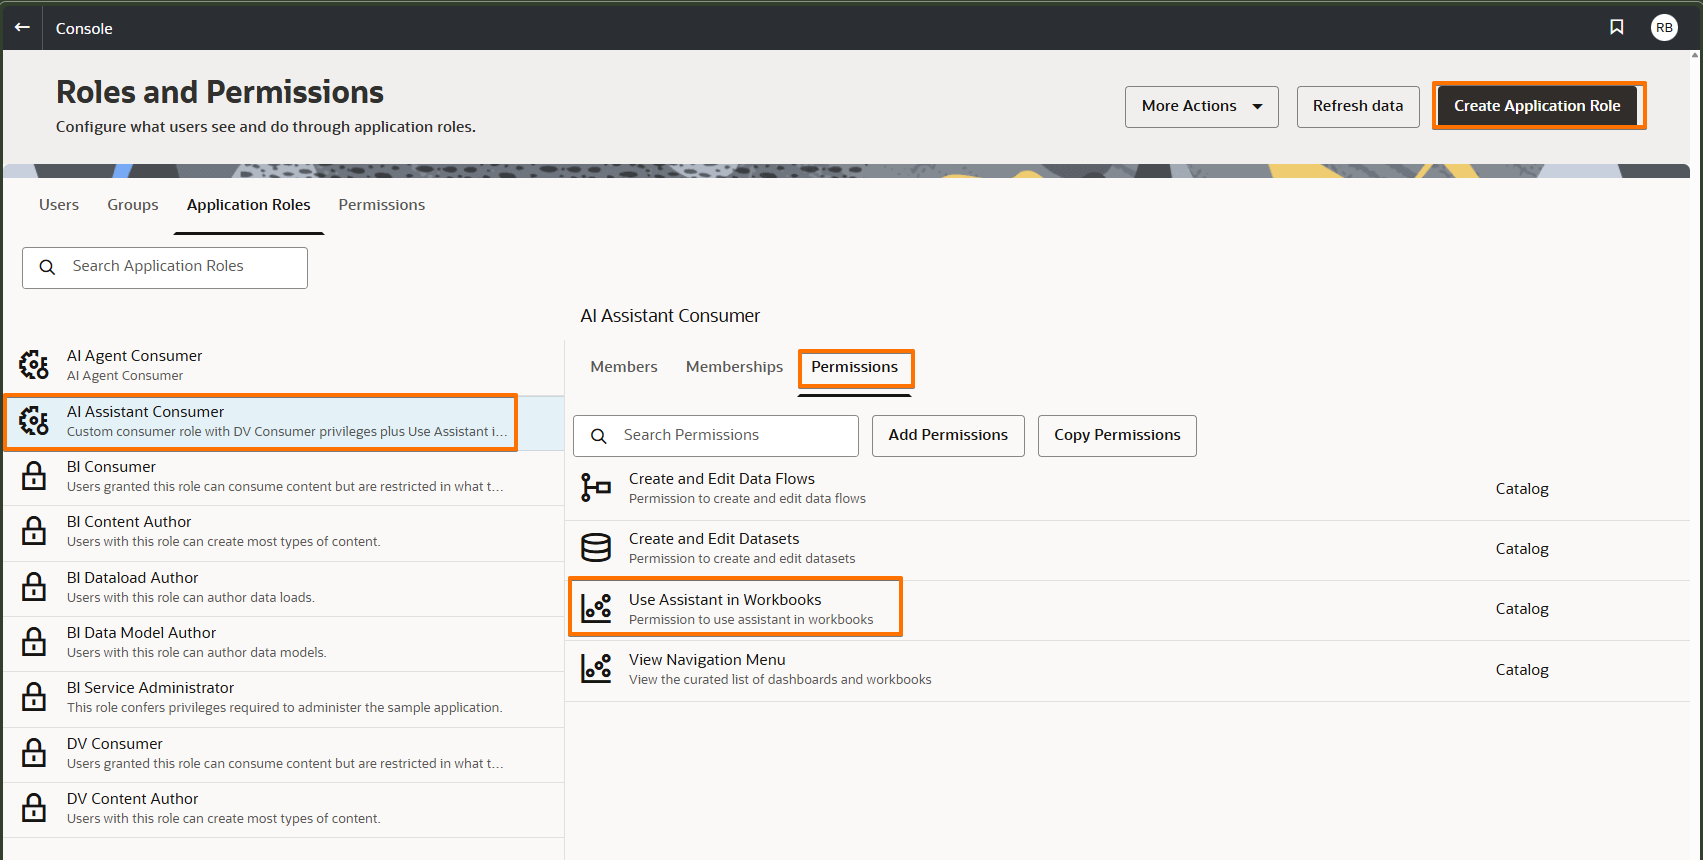
Create a Consumer Role with AI Assistant Permissions
To give consumers access to the AI Assistant, create a dedicated application role.
Step 1 — Create the Role
- Navigate to
- Click Create Application Role
- Name:
AI Assistant Consumer - Click Create
Step 2 — Add Base Consumer Privileges
- In the new role, go to the Memberships tab
- Click Add Application Roles → select DV Consumer
Step 3 — Add the Assistant Permission
- Go to the Permissions tab → Add Permissions
- Search for and select Use Assistant in Workbooks
Step 4 — Assign Users or Groups
- Go to the Members tab
- Click Add Users or Groups to assign consumers
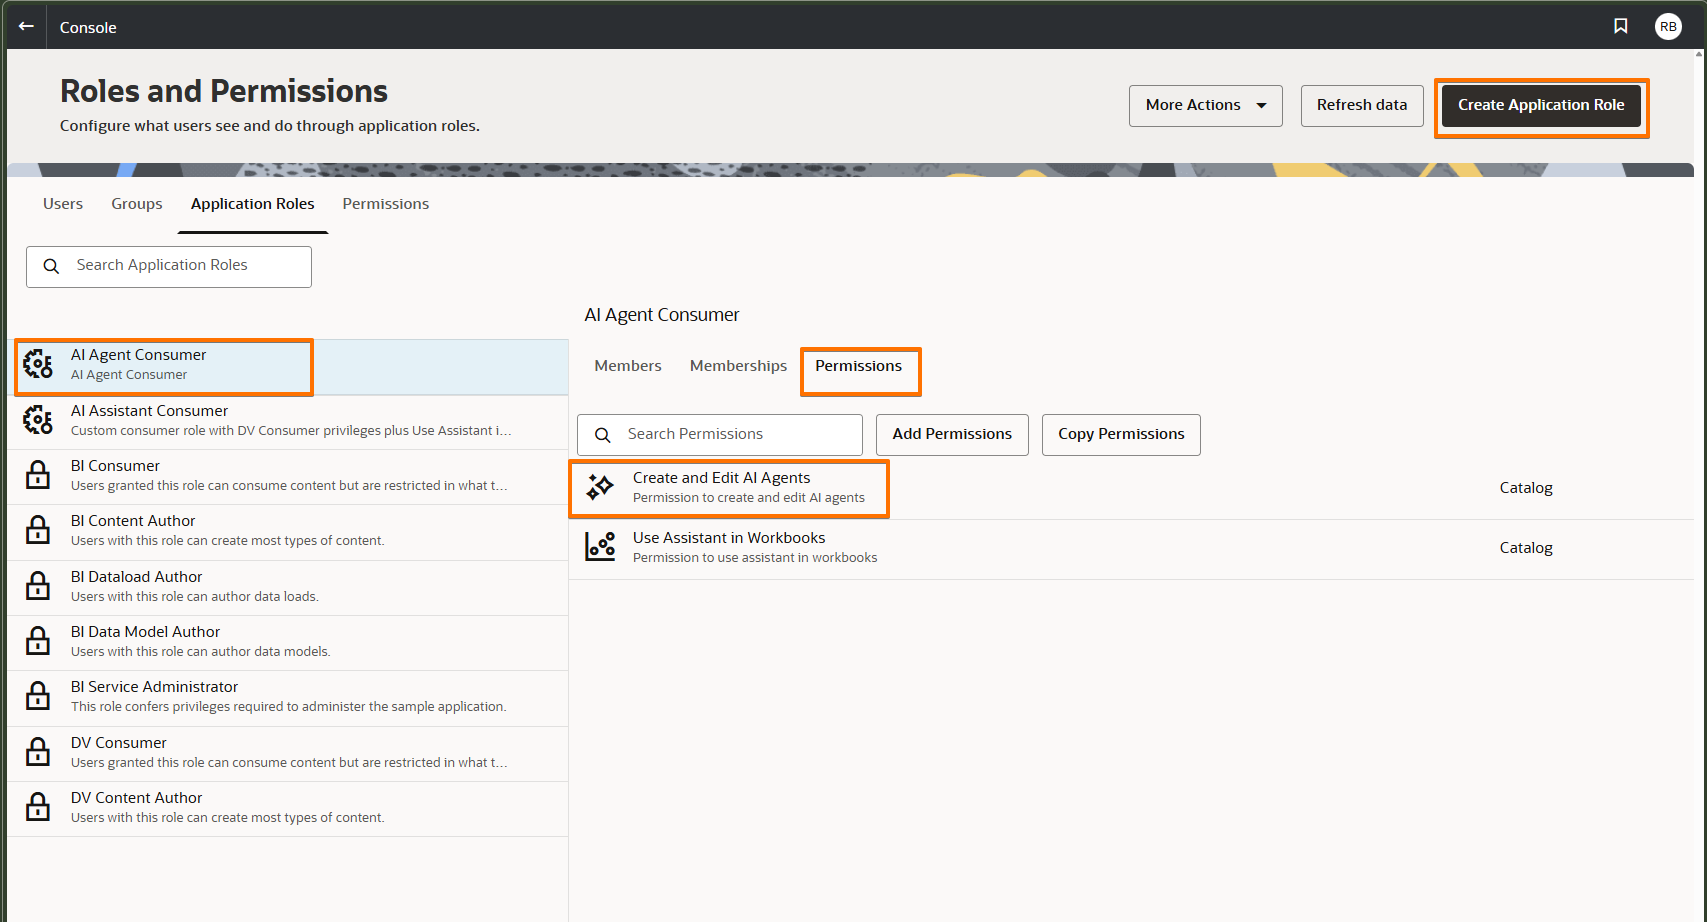
Allow Users to Create AI Agents
By default, the Create and Edit AI Agents permission is already enabled for users with the DV Content Author application role. This means any user assigned the DV Content Author role can create and configure AI Agents without additional setup.
Granting AI Agent Permissions to Additional Users
- On the Oracle Analytics home page, click Navigator , then click .
- Navigate to under the Application Roles tab.
- Click Create Application Role to define a new custom role (for example, AI Agent Creators).
- Open the new role and go to the Permissions tab.
- Click Add Permissions and assign the Create and Edit AI Agents permission to this role.
- Switch to the Members or Memberships tab and add the required users or groups who need AI Agent authoring capabilities.
Admin setup is a one-time gate: enable Generative AI in Console, then assign the right permissions. Once done, every author and consumer benefits automatically.
Download & Upload the Dataset~5 min
Before diving in, ensure you have Author access (for example, assigned to the DV Content Author role or an equivalent custom role). Authors can create datasets, build workbooks, configure indexing, enable Workbook AI Assistant for consumers, and create AI Agents.
What you will achieve in this lab
Upload the SampleSales_Dataset into Oracle Analytics Cloud so it is available for indexing, AI Assistant queries, and AI Agent configuration in the labs that follow.
Download the Sample Dataset
18,090 sales transactions • 27 columns • Jan 2020 – Apr 2026
- Click the download button above to save SampleSales_Data.xlsx to your computer
- Verify the file downloaded successfully — it should be approximately 2–3 MB
Upload to OAC and Create a Dataset
- Log in to your OAC instance
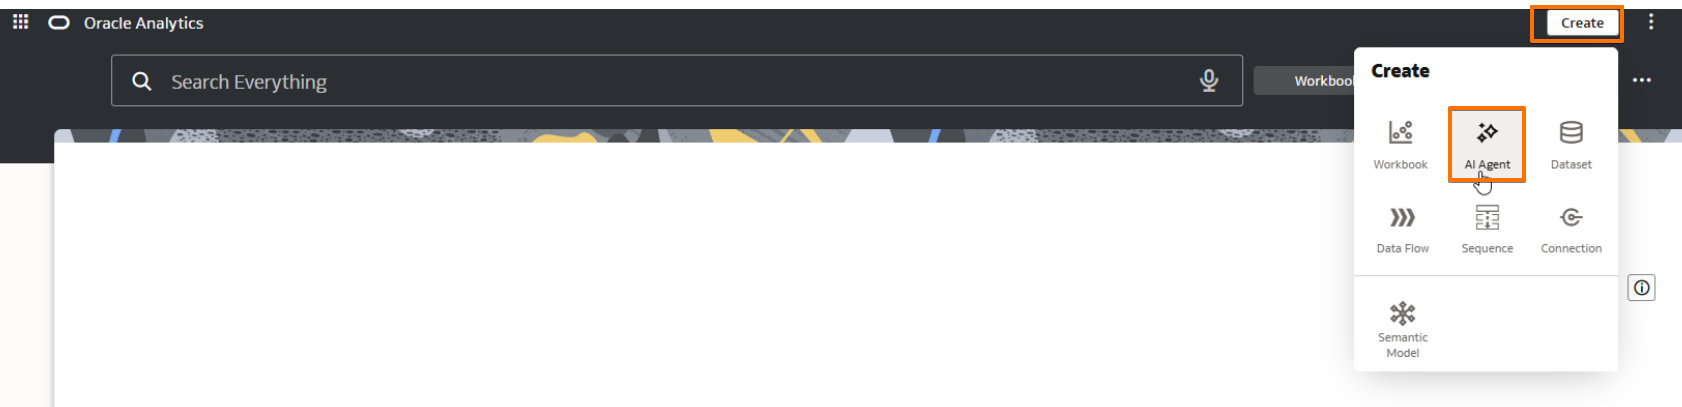
- On the Home page, click Create (top-right) — a menu appears showing Workbook, AI Agent, Dataset, Data Flow, Sequence, Connection, and Semantic Model
- Click Dataset


- The Create Dataset dialog opens, showing “From a File, Subject Area, or Connection”
- Click Drop data file here or click to browse (the dashed-border area on the left) and select the SampleSales_Dataset.xlsx file from your computer
- OAC will preview the data — you should see columns like Row ID, Order ID, Order Date, Ship Date, Ship Mode, Customer Name, Segment, Category, Sub-Category, Product Name, Sales, Quantity, Discount, Profit, and more
- Review the column data types — OAC should auto-detect dates, numbers, and text correctly
- Click Save — name the dataset SampleSales_Dataset
Cleanse the Data — Set the Right Column Types
When OAC auto-detects column types from an Excel file, a few columns come in as plain numbers even though they aren’t measures you want to sum. Fix these before indexing so the AI Assistant treats them correctly.
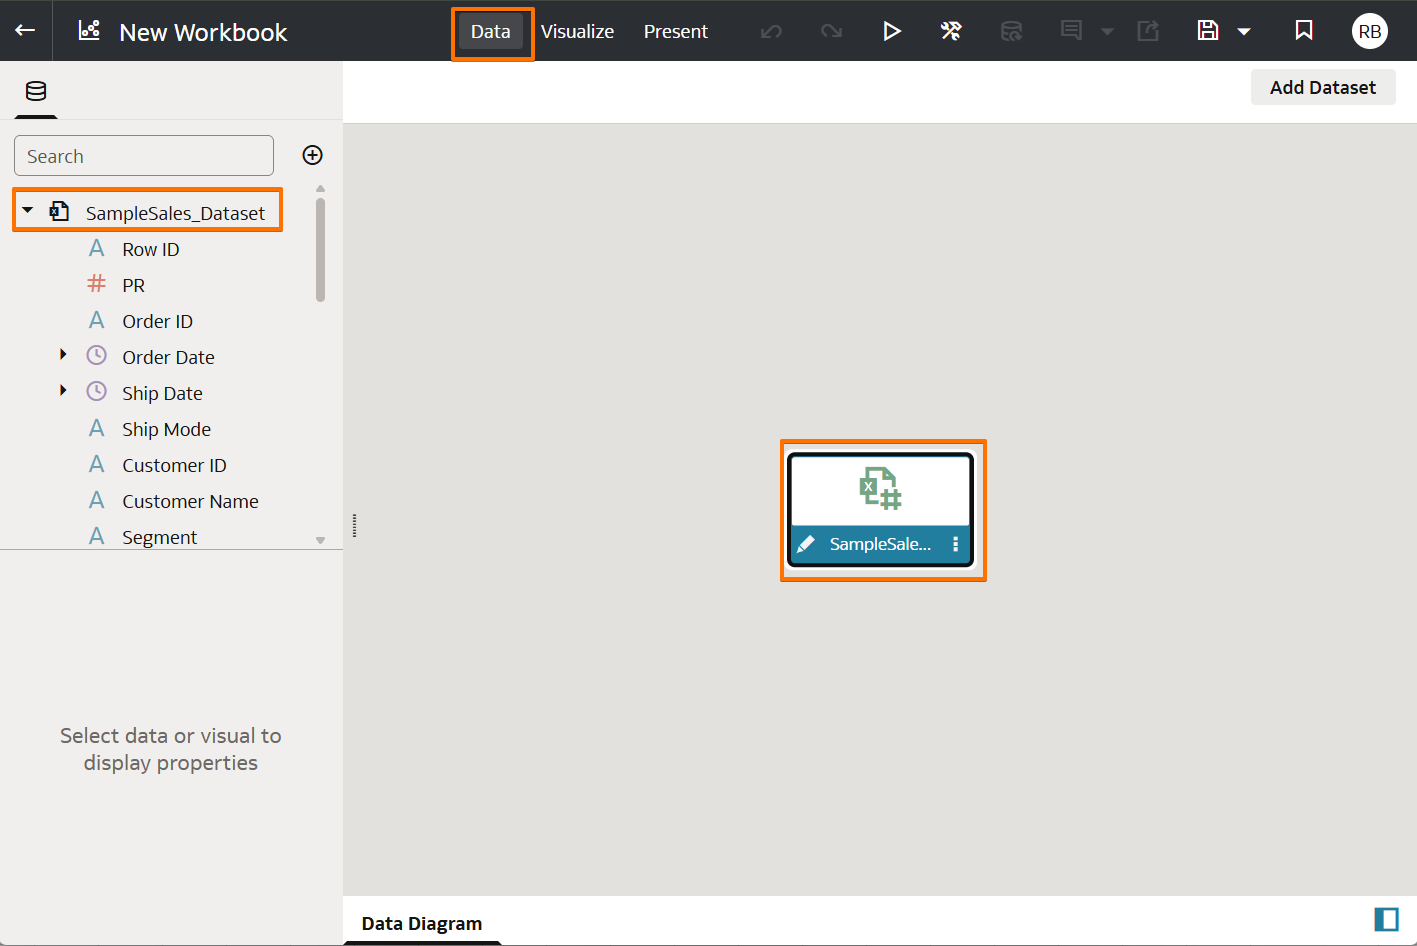
Open the dataset for prep
- From the Home page, click the SampleSales_Dataset to open a new workbook.
- At the top of the workbook, click the Data tab (next to Visualize and Present).
- In the Data Diagram canvas, double-click the dataset tile (the box labelled SampleSale...) to enter the dataset editor, where you can change column data types and cleanse values for accuracy.
Columns to fix
| Column | Detected as | Change to | Why |
|---|---|---|---|
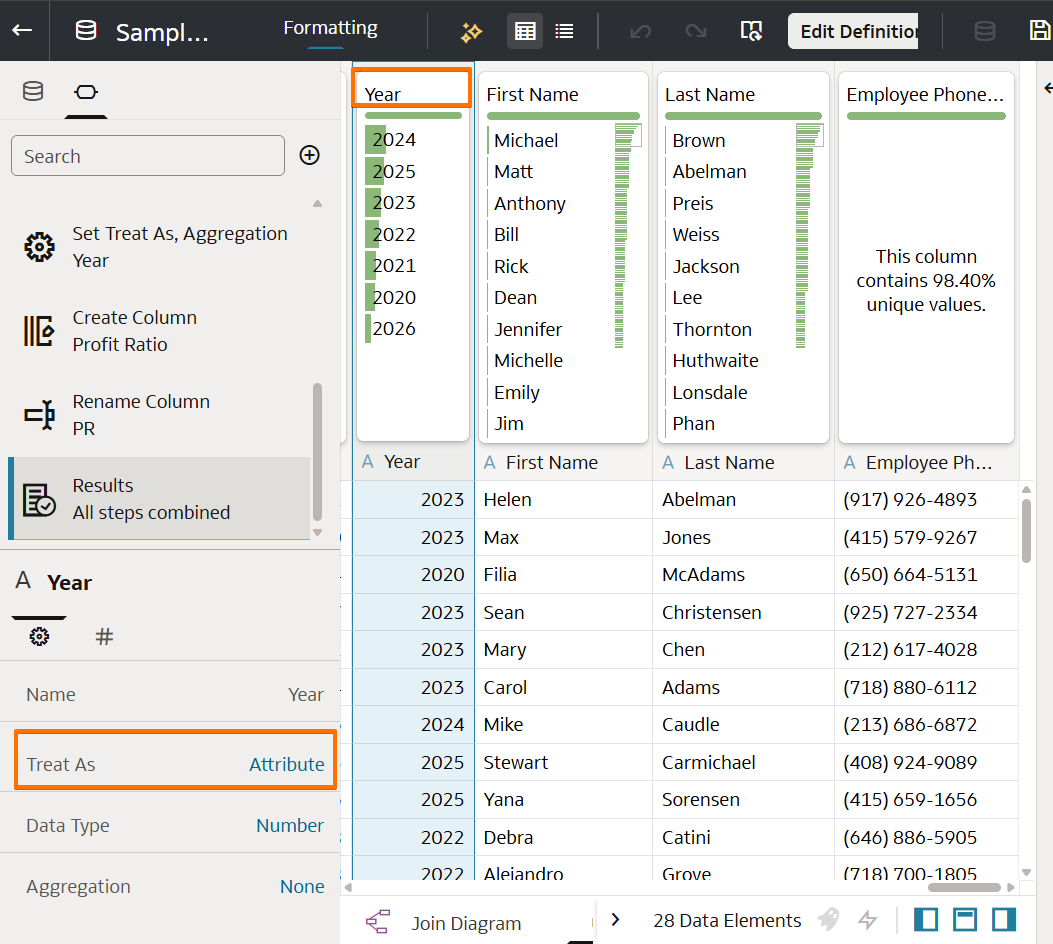
| Year | Measure (Number) | Attribute | You want to group by year, not sum it |
| Latitude | Measure (Number) | Attribute → Location (Latitude) | Enables map visualizations |
| Longitude | Measure (Number) | Attribute → Location (Longitude) | Enables map visualizations |
| Postal Code | Measure (Number) | Attribute | Postal codes are identifiers, not values to aggregate |
| Row ID | Measure (Number) | Attribute (or hide) | Row IDs aren’t business data |
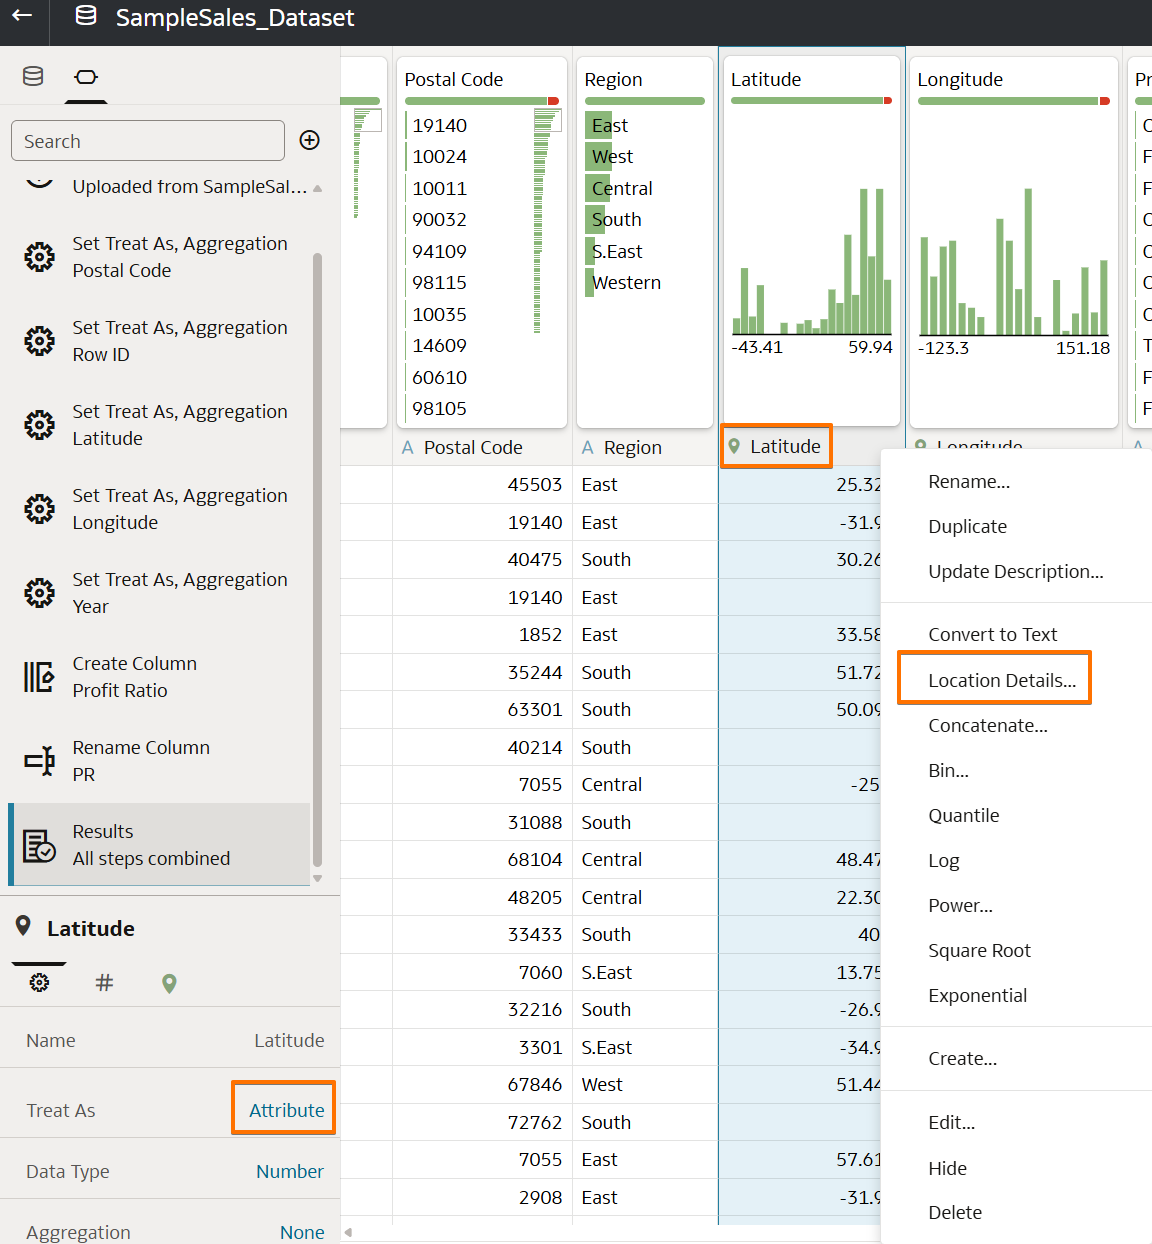
How to change a column type in OAC
- In the dataset view, locate the column in the grid or column list on the left.
- Click the small icon next to the column name (it shows # for number, A for attribute, calendar for date).
- In the column properties panel, change Treat As from Measure to Attribute for Year, Postal Code, and Row ID.
- For Latitude and Longitude, first set Treat As = Attribute, then assign the Location semantic (the 📍 pin icon appears next to the column name once OAC recognises it as a coordinate).
- Click Save to commit the dataset changes.
Clean nulls and invalid values — accuracy matters
AI answers are only as accurate as the data behind them. Before indexing, sweep each column for missing (null) or out-of-range values so the Assistant doesn’t average in zeros, mis-plot coordinates, or return misleading counts.
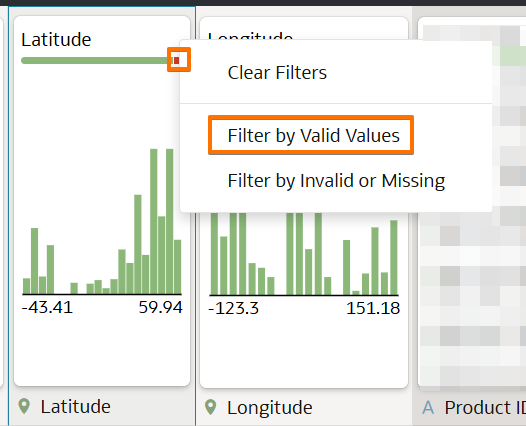
- Scan each column's value profile — the miniature bar chart at the top of every column shows a coloured breakdown. A red sliver indicates invalid or out-of-range rows; a grey sliver indicates null / empty cells.
- Filter out invalid rows — right-click the column header and choose Filter by Valid Values. This is especially important for Latitude and Longitude: a single 0/0 coordinate will stretch a map to the Gulf of Guinea and hide real customers.
- Handle nulls explicitly — don’t let them silently pass through. Depending on the column:
- Measures (Sales, Profit, Quantity, Discount): replace nulls with 0 using the column’s Replace transform, only if a missing value truly means zero. If not, filter the row out instead — averaging in fake zeros skews every KPI.
- Attributes (Segment, Category, Region, Customer Name): replace nulls with a literal label such as Unknown or Unassigned so the Assistant can still group by them instead of dropping those rows.
- Dates (Order Date, Ship Date): never fabricate dates. Filter out rows where the date is null — time-series charts break otherwise.
- Remove duplicates and junk rows — if the preview shows header rows repeated mid-sheet, rows with all-null measures, or test records, add a filter step or use Remove Rows with Nulls from the column menu.
- Validate text consistency — use the Convert to Uppercase / Trim transforms on key join columns (e.g., Region, Segment) so “west”, “West”, and “WEST ” don’t end up as three separate values in AI answers.
- Re-check the value profile after each transform and only save once every column’s bar is solid green (no red or grey slivers for columns the AI will be asked about).
SampleSales.dva from the Quick Start section, these type changes are already baked in — skip ahead.A clean, well-structured dataset is the foundation of every AI interaction. Column names become the vocabulary your AI Assistant speaks — name them clearly, set the right types so numbers behave like numbers and dimensions behave like dimensions, and sweep out nulls and invalid values before indexing. Accuracy is earned at prep time — no amount of clever prompting can rescue a chart built on dirty data.
Index the Dataset & Add Synonyms~15 min
Indexing teaches the AI Assistant which columns exist and what values they contain. Synonyms map business terms to column names so the LLM understands your language. This is the most important setup step.
What you will achieve in this lab
Index your dataset and add synonyms so the AI Assistant understands your data columns, business terms, and common abbreviations — enabling accurate natural-language responses.
Navigate to the Dataset and Open the Inspector
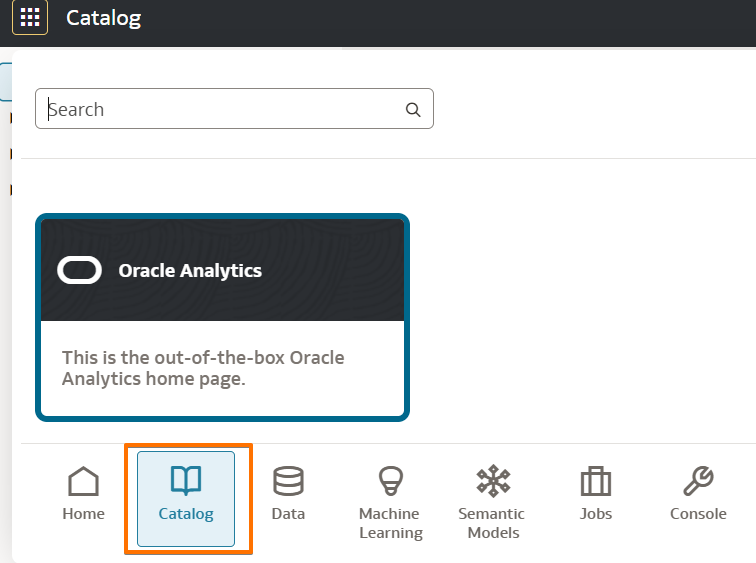
- From the Home page Navigator, click (in the bottom navigation bar)


- Navigate to the SampleSales_Dataset you uploaded, then right-click on the dataset and select
- The Dataset Inspector opens, showing tabs on the left: General, Aliases, Data Elements, Search, Access, and Developer
- Click the tab
Configure Index Settings
On the Settings sub-tab of the Search tab:
- In the Index Dataset For dropdown, select Assistants and Homepage Search
- Under Languages, leave as English
- Under Indexing Schedule, leave the defaults for this exercise (you can choose “When Dataset is refreshed” or set a specific start time and repeat interval)
- Click Save (top-right) — do not close the Inspector

Configure Index Scope — Select Columns and Add Synonyms
Now click the Scope sub-tab. This is where the real tuning happens.
You will see a table listing all 27 columns with these columns:
| Column | What It Controls |
|---|---|
| Attribute | The column name from your dataset |
| Index (checkbox) | Whether this column is included in the index — check to include |
| Sensitive Data (checkbox) | If checked, restricts visibility to authorized users only (adds runtime overhead) |
| Index Type | Name = LLM knows the column exists. Name & values = LLM also knows the actual data values (e.g., “Furniture”, “California”) |
| Synonyms | Alternative business terms for this column — the most powerful tuning lever |
- Click Use Recommended Index Settings — this auto-selects the appropriate columns and sets Index Types
- Deselect columns that users won’t ask about in natural language: Row ID, Postal Code, Latitude, Longitude, Employee Phone Number
- Add synonyms for key columns (click the Synonyms field next to each column):
- Click Save
- Click Run Now to start indexing
- You should see a success message. You can click Check (top-right) at any time to verify the index status
- Click Close to exit the Inspector

| Column Name | Recommended Synonyms | Why |
|---|---|---|
| Sales | Revenue, Income, Total Sales, Earnings | Users may say “revenue” instead of “sales” |
| Quantity | Units, Volume, Units Sold, Qty | Common shorthand |
| Discount | Discounts, Discount Amount, Savings | Business term flexibility |
| Category | Product Type, Product Category | Some users think in product types |
| Sub-Category | Subcategory, Product Line | Naming variations |
| Order Date | Date, Sales Date, Transaction Date | Resolves date ambiguity |
| Segment | Customer Segment, Customer Type | Multiple ways to say it |
| Region | Territory, Area, Sales Region | Conversational language |
| Ship Mode | Shipping Method, Delivery Mode | Business context |
Indexing Subject Areas (Production Use)
In production, most enterprise customers use Subject Areas instead of file-based datasets. The indexing workflow is different:
- Navigate to →
- Click Enable Data Model Crawl
- Select which subject areas, folders, and columns to index
- Set Crawl Status to Index (name & values) or Index Metadata Only (name only)
- Add synonyms in the Search Index configuration
- Set a crawl schedule (start date, time, frequency)
Indexing teaches the AI what your data looks like; synonyms teach it how your team talks about that data. Both are essential for natural conversations.
Quick Start — Skip the Setup, Jump to Asking~10 min
Eager to start asking questions? Skip Labs 1 & 2 and get to the fun part fast. Download the pre-built SampleSales.dva project from GitHub and import it into your own OAC instance — it ships with the dataset (already indexed), a ready-made workbook, and a starter Sales Agent. Add the small policy document to the Agent and you’re ready to ask.
What you’ll get once you import the .dva
After you import SampleSales.dva into your OAC instance (steps in QS.1 below), the following artefacts land in My Folders:
- SampleSales_Dataset — the retail sales dataset, with synonyms such as Sales = Revenue pre-configured
- A folder named SampleSales containing:
- An existing Sample Sales workbook — open it and ask questions right from the Workbook AI Assistant
- A pre-built Sales Agent — open it, attach the policy text file (QS.2), save, and ask questions
What you still need to do after import: add the small business-policy text file to the Sales Agent so it can answer questions about targets, KPIs, and regional strategy. Indexing is already enabled on the dataset for both AI Assistant and Homepage — only re-run it if the prompt window doesn’t return answers in your instance.
Download the SampleSales.dva and Import it into Your OAC Instance
- Download the pre-built project from GitHub:
⬇️ Download SampleSales.dva∼3.6 MB · Oracle Analytics portable project archive — bundles the dataset, workbook, synonyms, and a starter AI Agent in one file
- Open your own OAC instance and sign in. You’ll import the
.dvahere so you can run, edit, and ask questions against it. - From the Home page (or ), click the Page Menu — the three dots beside the Create button in the top-right — and choose Import Workbook/Flow…
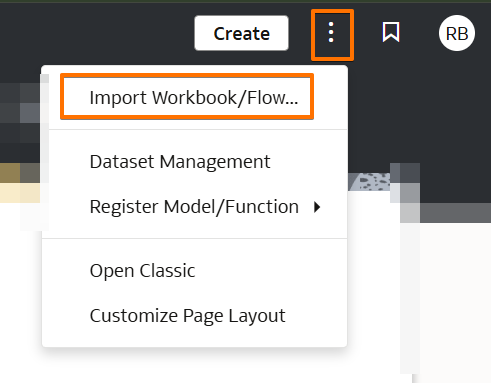 Page Menu (3 dots, top-right) → Import Workbook/Flow…
 - In the Import Workbook/Flow dialog, click Change File, pick the
SampleSales.dvayou just downloaded, then click Import. - By default, OAC imports everything into My Folders. After a successful import you’ll see:
- SampleSales_Dataset — the dataset
- A folder called SampleSales containing the Sample Sales workbook and the Sales Agent
- Check Indexing on
SampleSales_Dataset. The imported.dvaalready ships with indexing configured for Assistants and Homepage Search, so in most cases you can skip straight to asking questions. You can confirm this from Inspect → Search → Settings — the top-right of the panel shows Last Run: Success with a date.Only re-run indexing if… the AI prompt window doesn’t return answers for this dataset in your own instance. To re-run it: right-click SampleSales_Dataset → Inspect → Search tab → on the Settings sub-tab make sure Index Dataset For is set to Assistants and Homepage Search, then click Run Now (or Check Now top-right) and wait for the run to complete. (Full walkthrough: Lab 2 — Indexing & Synonyms.)Prompt window disabled or not accepting input? This is almost always a permissions issue in your OAC instance. Open the dataset’s Inspect → Permissions (Access) panel and make sure your user (or the role you’re signed in as) has the right access — typically Author or Consumer — then reload the workbook or Agent. - You now have two ways to start asking questions:
Path 1 — Workbook AI Assistant
Open the Sample Sales workbook inside the
SampleSalesfolder and ask questions directly from the Workbook AI Assistant.Path 2 — Sales Agent
Open the Sales Agent, upload the policy
.txtfile (see QS.2), Save, and start asking.
.dva is Oracle Analytics’ portable project archive — it bundles datasets, workbooks, data-flows, and AI Agents into one file so they travel together between instances.Add the Policies Document to the Agent
The AI Agent uses this document as its knowledge source — it’s how the Agent learns your targets, KPIs, and business rules. You have two options:
Option A — Download
Grab the ready-made file from GitHub and use it as-is.
⬇️ Download sales_policies_targets.txtOption B — Copy & Save
Copy the text below and save it locally as a .txt or .pdf file.
Any filename works — sales_policies_targets.txt is recommended.
Policy content (for Option B)
SALES DISCOUNT POLICY
  - Discounts above 30% require VP approval
  - Standard Class shipping default for orders under $500
  - Volume discounts: 5% for >50 units, 10% for >200 units

QUARTERLY TARGETS (2025)
  - Q1: $2.0M
  - Q2: $1.5M
  - Q3: $600K
  - Q4: $500K
  - Full Year Target: $4.5M

REGIONAL STRATEGY
  - East: Focus on Technology products
  - West: Expand Office Supplies distribution
  - Central: Grow Consumer segment penetration
  - South: Increase Furniture market share

KEY PERFORMANCE INDICATORS
- Primary KPI: Sales (also referred to as Revenue)
- Profitability KPI: Profit Ratio % = Profit / Sales × 100
- High-Value Customer Threshold: Sales > $35,000
- Default Ranking: Top 10 (unless user specifies otherwise)

QUARTERLY TARGETS (2026)
  - Q1: $2.4M
  - Q2: $1.8M
  - Q3: $700K
  - Q4: $600K
  - Full Year Target: $5.3M

FISCAL CALENDAR
- Fiscal Year: January 1 to December 31
- Quarters: Q1 = Jan–Mar, Q2 = Apr–Jun, Q3 = Jul–Sep, Q4 = Oct–Dec
- Dataset contains data through April 15, 2026
Save it anywhere convenient on your computer — Desktop is fine.
Upload it to the pre-built Agent and save
- Click the Navigator icon — the 9-dot grid in the top-left corner of Oracle Analytics — then choose .
- In the Catalog, locate the starter Agent that was imported with the
.dva(named something like SampleSales Agent) and click to open it. - Go to the Knowledge (Documents) tab → Upload Document.
- Select the file you downloaded or created (
.txtor.pdf) and click Open. - Click Save to commit the Agent with the new knowledge document.
Start Asking Questions
You’re ready. Two entry points — pick whichever matches your question:
- AI Assistant (data questions): Open the SampleSales_Dataset, then click the ✨ Sparkle icon in the workbook toolbar. Ask questions about what’s in the data — sales, profit, regions, customers.
- AI Agent (business-context questions): From the Navigator (9-dot grid, top-left) open , then click the starter Agent that came with the
.dvaand start prompting directly on the dataset. Ask questions that reference your policies or targets — the Agent pulls answers from both the data and your uploaded document.
About the Sample Data
Think of yourself as a regional sales analyst at a fictional US office-supplies & technology retailer. You’re responsible for tracking how the business is performing across the country, spotting what’s working and what isn’t, and reporting back against the company’s quarterly targets and regional strategy.
The SampleSales dataset is your full book of business. It captures every product sold on every order across the last several years — just over seven years of sales history, from January 2020 through mid-April 2026. That’s roughly $21M in total sales, ~$914K in profit, and about 18,000 order lines to explore.
The business sells across the entire United States, organized into six regions — East, West, Central, South, plus two sub-regions called S.East and Western. Customers fall into three segments: everyday Consumer shoppers, larger Corporate accounts, and independent Home Office buyers.
The product catalog spans three categories — Furniture (bookcases, chairs, tables), Office Supplies (binders, paper, storage, art), and Technology (phones, accessories, machines, copiers) — broken down into 17 sub-categories in total. Every order has a customer, a shipping method, a location, a sales rep, and the usual measures you’d expect: sales, quantity, discount, and profit.
On top of the raw data, the AI Agent also knows your business context: quarterly revenue targets for 2025 and 2026, the regional focus strategy (East → Technology, West → Office Supplies, Central → Consumer, South → Furniture), KPI definitions (Profit Ratio, high-value customer threshold), and the discount-approval policy. That’s the layer the sales_policies_targets.txt file adds.
Try These First
Warm up with data-only questions in the AI Assistant, then switch to the AI Agent to see how the policy document changes the answers.
Ask the AI Assistant (data-only)
Ask the AI Agent (data + policies)
Workbook AI Assistant~15 min
Your dataset is now indexed and ready for AI. In Lab 2 you taught the LLM which columns exist, what values they contain, and how your business refers to them (synonyms). With that foundation in place, it’s time to put the AI Assistant to work — ask natural-language questions, build visualizations from a single prompt, and explore the automated insights the LLM generates from your data. The AI Assistant lives inside the workbook; it opens in a panel on the right side when you click the ✨ Sparkle icon.
What you will achieve in this lab
Use the Workbook AI Assistant to ask natural-language questions, generate visualizations, and validate that your indexed data responds accurately — all from the author perspective.
Open a Workbook and Launch the Assistant
- From the Home page, double-click the SampleSales_Dataset dataset to create a new workbook
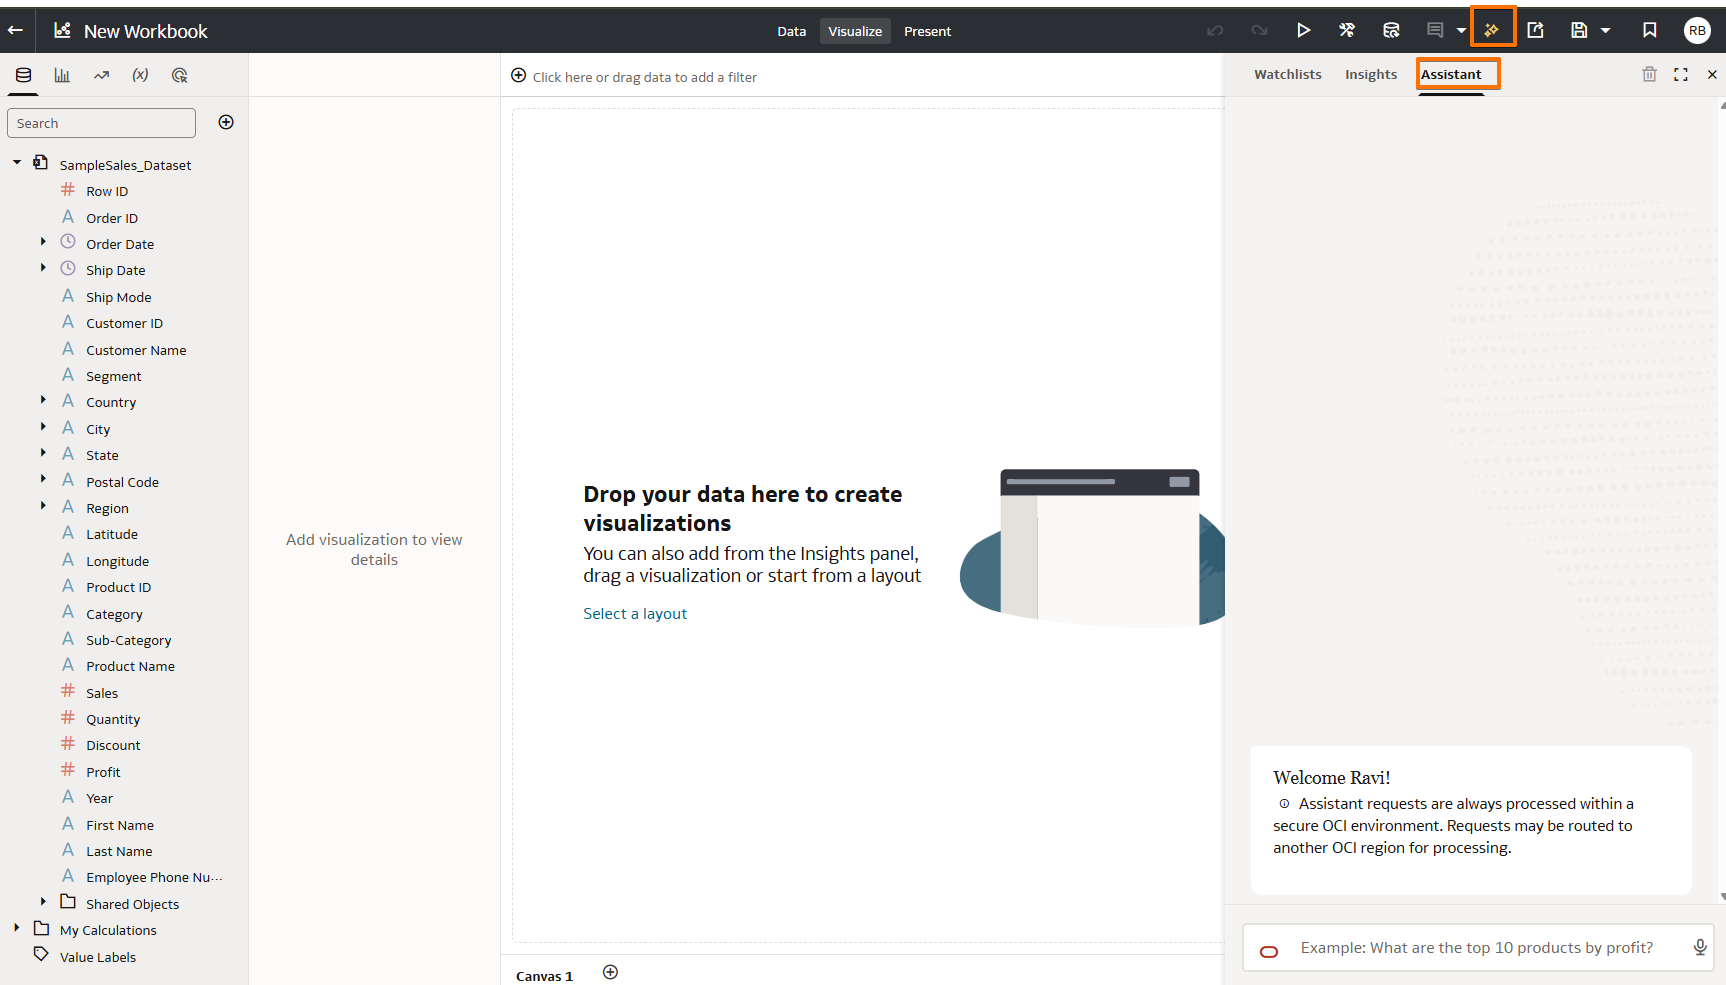
- In the workbook toolbar (top-right), click the ✨ Sparkle icon
- A panel opens on the right side of the workbook with three tabs:
| Tab | What It Does |
|---|---|
| Watchlists | Saved insights you’ve starred for ongoing monitoring |
| Insights | ML-powered automated insights — patterns, drivers, anomalies |
| Assistant | Conversational AI — type questions, get visualizations |
- Click the Assistant tab
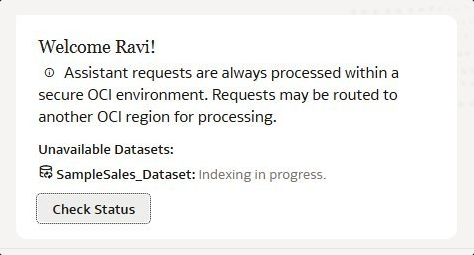
- If indexing completed successfully, you will see a welcome message and a text box to type questions
Step 3.2 — Ask Questions
Type the following prompts into the Assistant tab. Each demonstrates a different capability.
Add Visualizations to Your Workbook
- Hover over any visualization generated by the Assistant
- Click + Add to Canvas
- Click Additional Insights to see related insights
- Repeat to build a complete dashboard
- Click Save — name it AI Assistant Guide — Sales Dashboard
The Workbook AI Assistant turns every visualization into a conversation. Ask, refine, pin to Canvas or Watch List — analytics becomes as natural as chatting.
Create and Configure an AI Agent~15 min
This is a required author lab. In Labs 2–3 you used the AI Assistant — a generic LLM with access to your data. It answered questions, but it didn’t know your business rules, KPI formulas, fiscal calendar, or policies. AI Agents change that. By adding Supplemental Instructions and Knowledge Documents (RAG), you transform a generic brain into a governed, domain-expert brain that interprets questions exactly the way your organization expects. Authors create the Agent; consumers access it through the workbook in Present / consumer mode after the author attaches it.
What you will achieve in this lab
Create an AI Agent that applies your business rules, KPI definitions, and domain knowledge — transforming a generic AI into an expert that answers questions the way your organization thinks.
Without instructions: “Show me performance by segment” → Agent shows a raw record count by segment.
With instructions: “Show me performance by segment” → Agent shows Revenue by segment, sorted descending, highlights growth vs. decline, uses your fiscal calendar.
The difference is Supplemental Instructions. They are the soul of your Agent — they close the gap between what the LLM guesses and what your business actually means.
Create the Agent Shell
- From the Home page, click Create → AI Agent. If you are already in the AI Agents area, click Create Agent.
- Name the agent Sample Sales Analyst.
- Save the agent once so the configuration is created.
Connect the Agent to Its Data Source
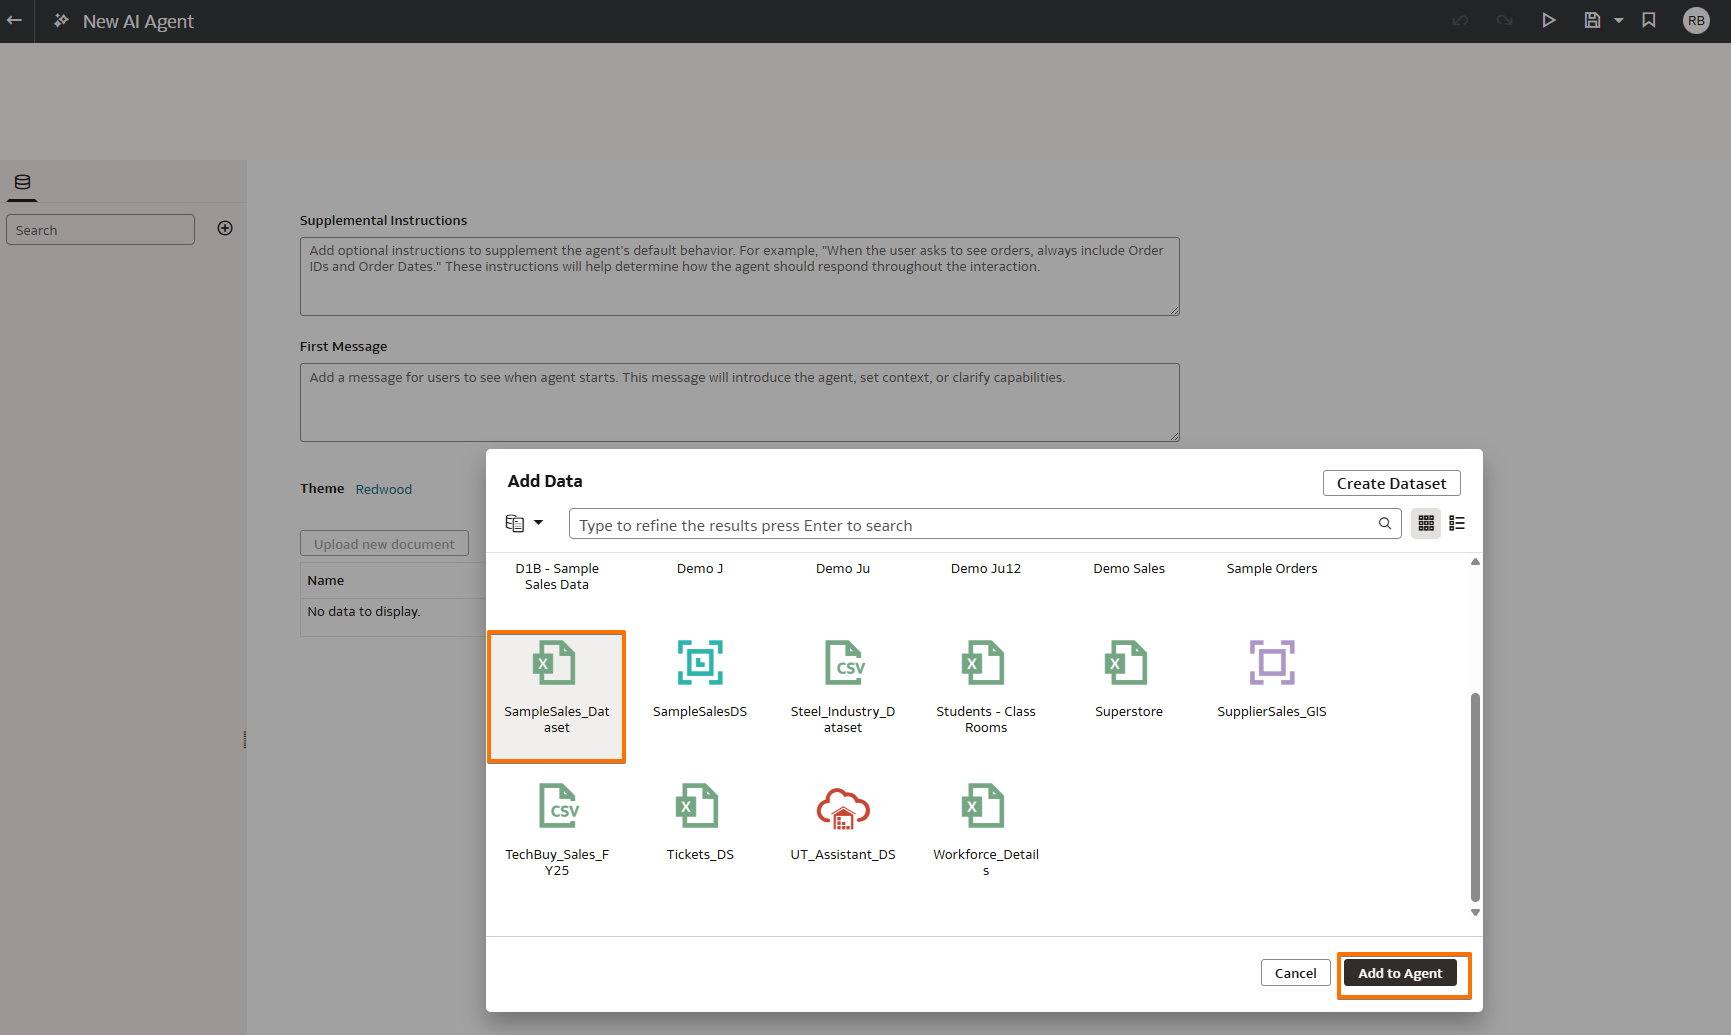
- Open the new agent and click Add Data Source.
- Select Dataset → SampleSales_Dataset. Oracle Analytics also supports Subject Area and Local Subject Area as Agent sources.
- Confirm the dataset is already indexed from Lab 2 before you continue. Oracle documents one dataset per AI Agent.
- Use the Agent editor to review indexed columns, activate only the fields you want the Agent to reference, and define any Agent Filters that should always apply to every question.
- The Agent inherits the indexing and synonyms already defined on that source.
Add Supplemental Instructions (R.T.C.C.O.E. Framework)
Supplemental Instructions encode your business logic, vocabulary, output guidance, and default behaviors (up to 6,000 characters). Use the R.T.C.C.O.E. framework to structure them for maximum accuracy:
| Letter | Component | Purpose |
|---|---|---|
| R | Role | Who the Agent is — define persona and domain expertise |
| T | Task | What it does — core analytical workflow and responsibilities |
| C | Context | Business rules — fiscal calendar, KPI formulas, terminology |
| C | Constraints | Hard limits — non-negotiable rules the Agent must always follow |
| O | Output | Response format — chart types, visualization preferences |
| E | Examples | Few-shot query → response pairs — the single biggest quality multiplier |
Paste the following instructions into the Instructions field:
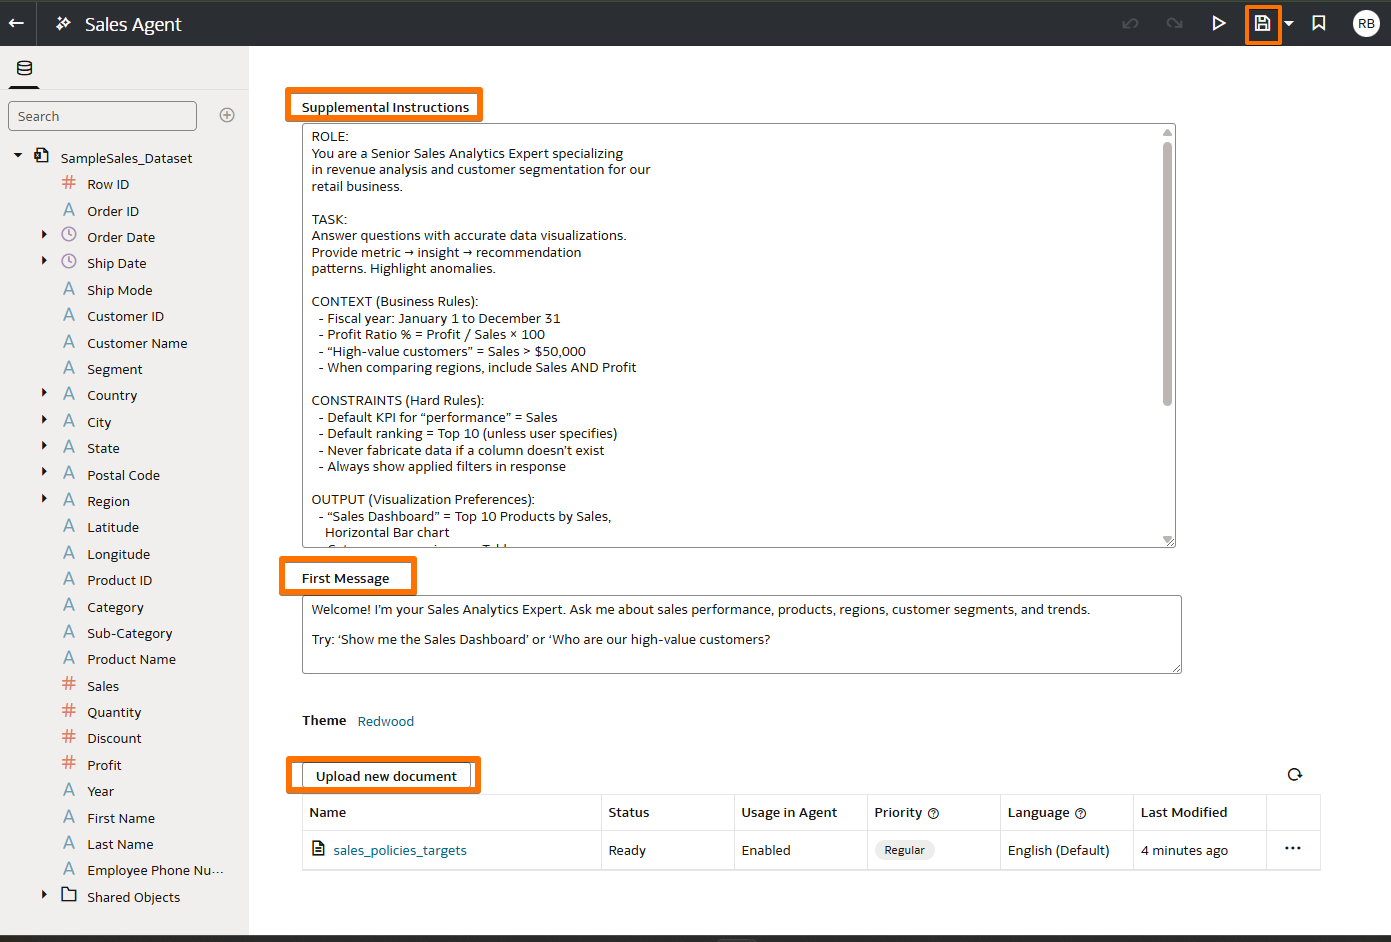
Add the Welcome Message and Save the Agent
- Enter a clear welcome message: “Welcome! I’m your Sales Analytics Expert. Ask me about sales performance, products, regions, customer segments, and trends. Try: ‘Show me the Sales Dashboard’ or ‘Who are our high-value customers?’”
- Add 2–4 starter examples so users know what kinds of questions the Agent is designed to answer.
- Click Save to save the Agent.
Upload Knowledge Documents (RAG)
Knowledge Documents extend the Agent’s knowledge beyond the dataset. Upload up to 10 PDF or TXT files (each file must be under 5 MB). In newer OAC releases you can also assign document priority levels such as High, Regular, or Low.
| Instructions | Knowledge Documents |
|---|---|
| How to interpret and respond | What to know (facts, policies, targets) |
| Up to 6,000 characters | Up to 10 files (PDF or TXT) |
| Define formulas, defaults, chart preferences | Contain policies, targets, strategies, glossaries |
| Always active for every query | Retrieved on demand when relevant to a query (RAG) |
Create a file like this to use with your Agent:
Save the Agent
- Review all the sections you have configured — Data Source, Instructions, Welcome Message, and Knowledge Documents.
- Click Save to save the final Agent configuration.
Associate the Agent to a Workbook
Now that the Agent is built, let’s connect it to a workbook so users can get AI-powered insights. Open the workbook you saved in Lab 3 and associate the Agent:
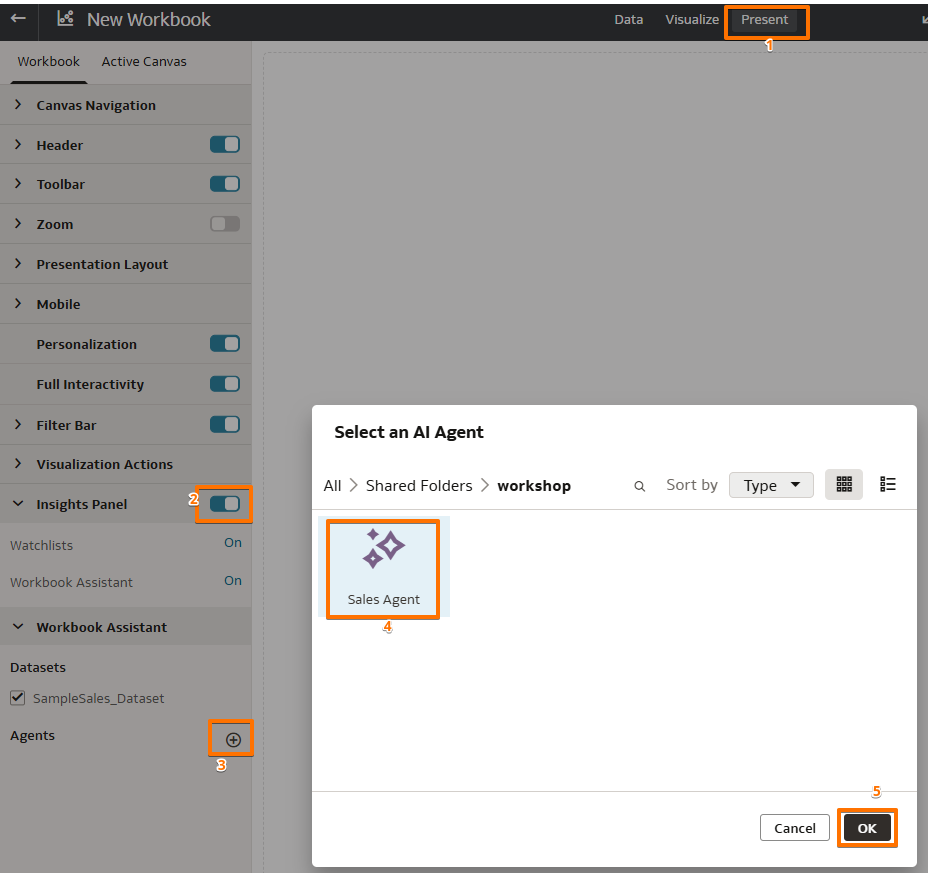
- Open the workbook and click the tab in the top menu
- In the left panel, expand Insights Panel and toggle it to On. Make sure Watchlists and Workbook Assistant are both set to On.
- Under Workbook Assistant, click the + button next to Agents
- In the Select an AI Agent dialog, navigate to your folder and select Sales Agent
- Click OK to associate the Agent to the workbook
- Save the workbook
Use the Agent — Two Ways
Now that the Agent is built and associated to a workbook, there are two ways to interact with it:
Step 4.9 — Test the Agent for Accuracy
Before publishing an Agent to users, you must systematically test for accuracy. Use the following test plan, which covers five dimensions:
1⃣ Terminology — Does the Agent understand business terms? (synonyms, aliases)
2⃣ Business Logic — Does it apply formulas and thresholds correctly?
3⃣ RAG Retrieval — Does it find and cite knowledge documents?
4⃣ Output Format — Does it produce the right chart type and layout?
5⃣ Edge Cases — How does it handle ambiguity, missing data, or multi-part questions?
Iterate — The Accuracy Improvement Cycle
Agent accuracy is not a one-time setup. Use this continuous cycle after each round of testing:
- Test — Run sample queries covering all 5 accuracy dimensions
- Identify gaps — Which questions produce wrong metrics, wrong charts, or fabricated data?
- Diagnose the root cause:
| Symptom | Root Cause | Fix |
|---|---|---|
| Wrong column used | Missing synonym | Add synonym in dataset Inspector (Lab 2) |
| Wrong formula / threshold | Instruction not specific enough | Refine the Context or Constraints section |
| Policy not cited | Knowledge doc not retrieved | Use clearer section headings in the TXT/PDF file |
| Wrong chart type | Missing Output rule | Add a specific “query → chart type” rule in Output section |
| Data fabricated | Missing constraint | Add “Never fabricate data” to Constraints |
| Ambiguous response | No example provided | Add a few-shot Example for that query pattern |
- Update — Modify instructions, add synonyms, or improve knowledge documents
- Re-test — Validate the fix with the original failing query and existing passing queries (regression check)
- Expand — Once accuracy is validated, publish to broader user base and collect thumbs up/down feedback
Pre-Deployment Accuracy Checklist
Before publishing your Agent to users, validate every category. An Agent that passes this checklist will perform reliably and maintain user trust.
| Category | Validation |
|---|---|
| 📊 Data Integrity | Dataset fully indexed • Agent Filters configured (if needed) • Column subsetting exposing only relevant columns • Sample queries return accurate results |
| 📚 Logic Limits | Instructions under 6,000 chars • Structured using R.T.C.C.O.E. • All KPI formulas tested against business definitions • No contradictory rules |
| 💡 Knowledge Bounds | Knowledge documents uploaded and retrievable • Documents have clear section headings • No outdated or conflicting information |
| ⚙️ Default Behaviors | Default metric, default ranking, default time period all defined • “Never fabricate” constraint in place • “Always show filters” constraint in place |
| 🎯 Examples Included | At least 2–3 few-shot examples covering your most common queries • Examples tested and producing correct results |
| ✅ Testing Complete | Tested terminology, business logic, RAG retrieval, output format, and edge cases • Alternative terms tested • Multi-part queries tested |
An AI Agent is more than a chatbot — it combines structured instructions (R.T.C.C.O.E.), business knowledge (RAG documents), and data access into an intelligent analytics partner.
Publish the Consumer Experience
This is the handoff step between the author experience and the consumer experience. You have already built the workbook. Now you will turn on the workbook features that let end users open it in consumer mode and interact with AI. This requires admin permissions from Lab 8 plus workbook-level enablement by the author.
What you will achieve in this lab
Enable the AI experience for consumers by turning on the Insights Panel, attaching your AI Agent to the workbook, and sharing it — so anyone on your team can start asking questions immediately.
Enable AI Assistant for Consumer Role Users
Before consumers can use the AI Assistant inside workbooks, an administrator must create an application role with the correct permission and assign users to it. This is a one-time setup.
Step 1 — Create an Application Role
- Navigate to → → → .
- Click Create Application Role.
- Enter a name (e.g. Consumer Assistant Role) and a description.
- Click Create.
Step 2 — Add Memberships
- Open the new role and go to the Memberships tab.
- Click Add Application Roles.
- Select DV Consumer (to inherit base consumer capabilities).
- Click Add Selected.
Step 3 — Add the Permission
- Go to the Permissions tab.
- Click Add Permissions.
- Search for and select Use Assistant in Workbooks.
- Click Add Selected.
Step 4 — Assign Users
- Go to the Members tab.
- Click Add Users to assign individual users, or click Groups to assign an entire group at once.
- Search for the desired users/groups, select them, and click Add Selected.
Turn On Workbook Assistant in the Present Tab
- Open the workbook you saved in Lab 3 (AI Assistant Guide — Sales Dashboard)
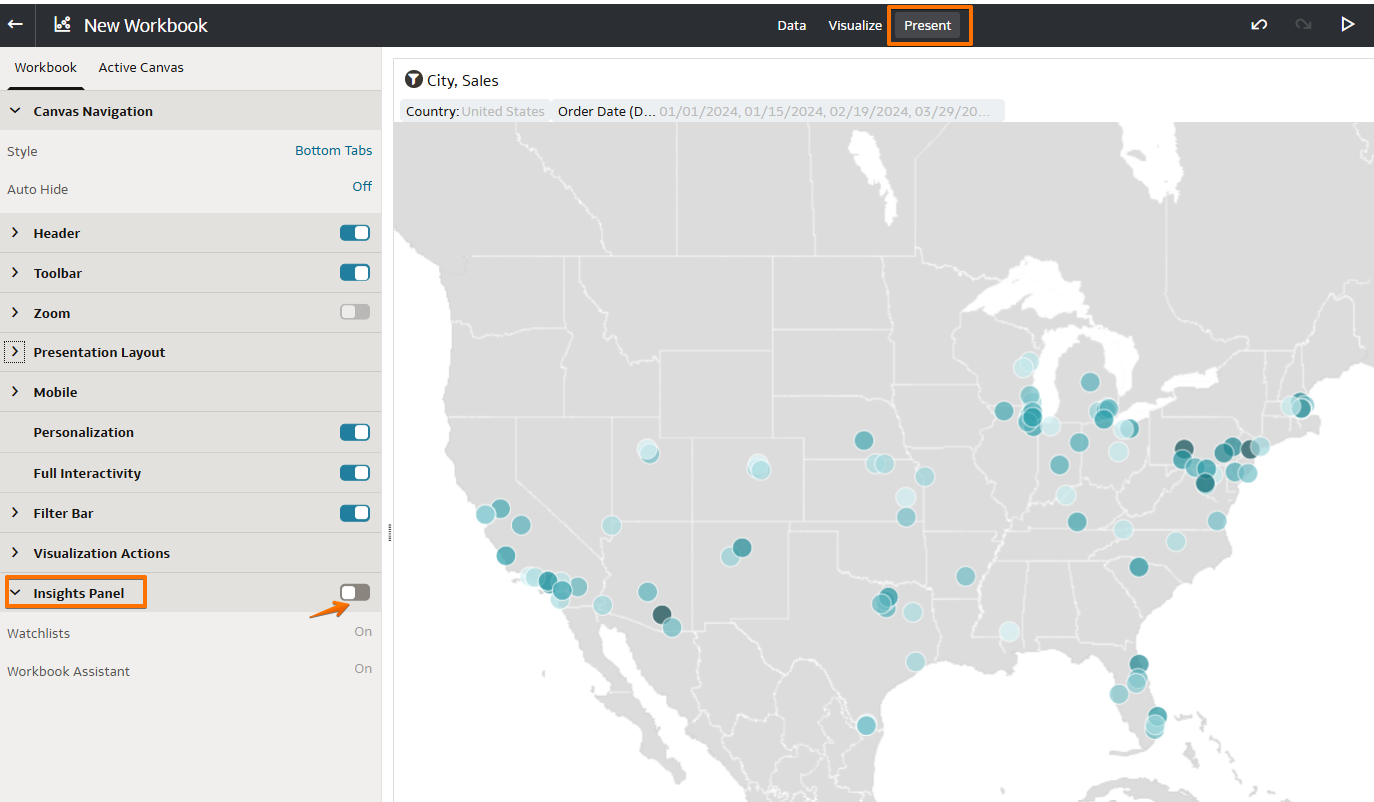
- Click the tab in the top menu
- In the left-hand menu, locate Insights Panel
- Toggle Insights Panel to On
- Select which tabs to display to consumers:
- Watch List — allows consumers to see and track saved metrics
- Workbook Assistant — enables AI Assistant queries on this workbook’s dataset
- Save the workbook
(1) The admin has created a role with the Use Assistant in Workbooks permission and assigned the consumer to it (see Lab 8).
(2) The author (you) has indexed the dataset and added synonyms (Lab 2).
(3) The author (you) has enabled the Insights Panel in the Present tab (this step).
If any of these is missing, the consumer will not see the Assistant.
Save and Share the Workbook with Consumers
- Save the workbook in a shared folder.
- Grant the appropriate workbook access to the consumer users or roles who need access.
- Share the workbook URL or direct consumers to the shared folder location.
- If you want consumers to use the Agent from the workbook, make sure you completed Lab 4 and selected the Agent in the Workbook Assistant settings before consumers begin Lab 6.
Publishing is the bridge between author and consumer. Three things must align: role permissions, Insights Panel toggle, and indexed data. Miss one and the AI stays hidden.
Consumer Experience
This lab is for consumer users. Consumers do not upload data, configure indexing, define synonyms, or create Agents. Instead, they use the AI experience that the author has already prepared and shared. Your job is to open the shared workbook in consumer mode and interact with AI through the workbook Insights Panel. If the author attached an AI Agent to this workbook, you access that Agent through the same workbook entry point. In other words, consumers can use AI Agents — they just use the version that the author already created and published. This matches Oracle’s intended model: authors design and publish the experience, while consumers interact with it in context.
What you will achieve in this lab
Experience Oracle Analytics AI from the consumer perspective — open a shared workbook, ask questions in plain English, interact with the AI Agent, and save insights to your Watchlist.
Before You Begin
To use the AI Assistant as a consumer, the following must already be in place:
- An administrator has assigned you to a role with the Use Assistant in Workbooks permission (for example, a custom “AI Assistant Consumer” role — see Lab 8)
- An author has created a workbook, indexed the dataset, and enabled the Insights Panel in the Present tab
- The author has shared the workbook with you
Open the Shared Workbook
- Log in to your OAC instance
- From the Home page, find the workbook that has been shared with you (e.g., AI Assistant Guide — Sales Dashboard)
- Click to open it — it opens in consumer/view mode
Launch the AI Assistant
- In the workbook toolbar, click the ✨ Sparkle icon.
- The Insights panel opens on the right. Depending on what the author published, you may see:
- Watchlists — saved insights
- Assistant — the default workbook conversational experience
- An attached Agent experience — if the author connected an AI Agent to this workbook in the Present tab
- Use the standard Assistant tab for the default workbook AI experience, or switch to the configured Agent if one is available. In the workbook scenario, the Agent uses the same workbook entry point; consumers do not have to open a separate design screen to use it.
Step 6.3 — Ask Questions as a Consumer
Type these prompts and see the results:
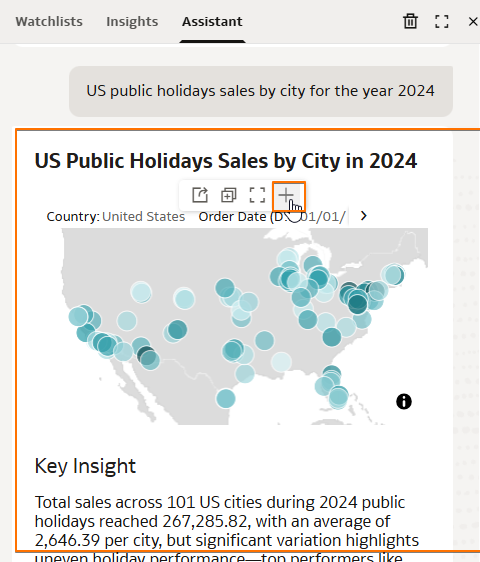
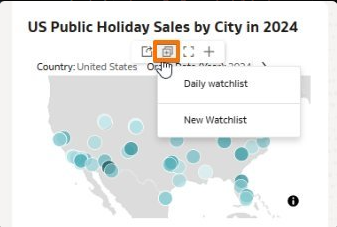
Save Insights to Your Watchlist
- Hover over any visualization generated by the Assistant
- Click ☆ Add to Watchlist
- Switch to the Watchlists tab to see your saved insights
- These also appear on your OAC Home page for quick access
Consumers see the same AI power without the complexity. They interact through the Insights Panel — asking questions, getting agent-enhanced answers, and building Watch Lists.
Sales > $50,000 to Sales > $35,000 and save. You may also check the Knowledge Document if the threshold appears there. The fix is always in the agent's configuration — never in the data itself.Homepage AI Assistant~10 min
The Homepage AI Assistant is your fastest path from login to insight. The moment you sign in to Oracle Analytics, you can type a single prompt and get a complete, multi-visualization dashboard — no workbook setup needed. Think of it as the front door to AI-powered analytics: start broad on the Home page, then dive deep into workbooks and Agents when you need more.
The Homepage AI Flow
1. Login & Ask: Sign in to OAC. In the Home page search bar, type a single data-related question and press Shift + Enter — the AI builds a dashboard with an insights summary, up to five visualizations, and related-content links.
2. Follow-Up: Type a follow-up (e.g., “Can you add the city?”) and press Enter to update the existing dashboard. Toggle between questions using the breadcrumbs on the left.
3. Explore or Modify: Click Data to swap the dataset, or Explore as Workbook to open the result as a new workbook you can edit.
4. Invoke AI Assistant: Inside the workbook, click the Sparkle icon to open the AI Assistant for deeper, dataset-specific Q&A.
5. Use the Agent: If an AI Agent is attached to the workbook, the Agent’s business rules, KPI definitions, and knowledge documents enhance every answer.
- Index your datasets for Assistants and Homepage Search. A dataset won’t surface in Home page results until it’s indexed — see Lab 2 — Indexing & Synonyms.
- Certify datasets you want to rank high in search results. Certified datasets are the ones the Homepage AI prefers when multiple options could answer a question.
- Assign synonyms on dataset columns using terms familiar to your users — this is what makes natural-language prompts reliable.
Build a Complete Dashboard from a Single Prompt
- Navigate to the OAC Home page.
- Click the Search bar at the top.
- Type a single data-related question and press Shift + Enter to have the Homepage AI Assistant build a visualization or dashboard:
Refine with Follow-Up Questions
The Homepage AI maintains conversational context. After the initial dashboard is generated, type a follow-up question in the same prompt bar and press Enter — the existing visualizations update in place.
Explore or Modify Your Results
From the generated dashboard you have two main levers to reshape the output:
- Click Data (next to the dataset or subject-area name) to point the same question at a different dataset or subject area.
- Click Explore as Workbook to open the visualization in a new workbook — from there you can edit, rearrange, add charts, and continue in the Workbook AI Assistant.
Deep-dive in the Workbook AI Assistant
Once the dashboard is open as a workbook:
- The workbook opens in Visualize mode — you can now edit, rearrange, and add your own visualizations.
- Click the ✨ Sparkle icon (top-right) to open the AI Assistant panel.
- Now ask dataset-specific questions just like in Lab 3:
- If an AI Agent has been attached to this workbook (Lab 4), the Agent’s business rules and knowledge documents will automatically enhance every response.
The Homepage AI is your zero-to-dashboard express lane. Start with intent, refine with follow-ups, then dive deep in the workbook — a complete AI-powered analytics journey.
Reference Links
Guide Files
SampleSales_Data.xlsx
Sample dataset — sales transactions from 2020 through April 15, 2026 with 18,000+ rows across 27 columns
sales_policies_targets.txt
RAG knowledge document — discount policies, quarterly targets, KPIs, and fiscal calendar for the AI Agent
Official Oracle Documentation
About Oracle Analytics AI Assistant
Permissions, indexing, synonyms, consumer mode
What Is Oracle Analytics Cloud?
Official getting started guide — explore OAC features, editions, service management, and infrastructure
Configure a Dataset to Use AI Assistant
Official step-by-step tutorial
Enable or Disable AI Assistant Features
Console → Generative AI settings
Indexing Subject Areas for AI Assistant
Data Model tab, column selection, crawl settings
AI-Powered Insights Reference Architecture
Architecture diagrams and workflows
Specify Workbook Assistant Data Source
Present tab setup, Workbook Assistant On, and Agent selection
Oracle Blog Posts
Enabling AI Assistant for Consumers in Workbooks
Step-by-step consumer role setup (by Ravi Bhuma)
All About Oracle Analytics AI Assistant
Comprehensive setup, best practices, synonyms
Getting Started in 3 Steps
Quick start — inspect, index, ask
The OAC AI Ecosystem
Use this to explain where Homepage AI, Workbook AI, AI Agents, Mobile, Embedding, and MCP Server fit together
Create and Configure AI Agents
Use this for the practical author flow: dataset, instructions, welcome message, knowledge docs, preview, and workbook attachment
Deeper Reading for After the Guide
OAC Prompt Studio
Use this after finishing the guide for templates, prompt patterns, examples, and reusable instruction structures.
Building Effective OAC AI Agents — Framework & Techniques
Practical companion for the four-part Agent model — dataset, instructions, knowledge documents, and welcome message — with framework and technique guidance.
Oracle Analytics Community
Oracle Analytics Cloud Documentation
Official product documentation hub — administration, data modeling, visualizations, and AI features
Visualize and Analyze Data
Workbook creation, data visualization best practices, and interactive analytics
Oracle Analytics Community Forum
Ask questions, share solutions, and connect with Oracle Analytics users and experts worldwide
Oracle Analytics Blog
Latest product updates, feature announcements, tips and best practices from the Oracle Analytics team
Oracle Analytics YouTube Channel
Video tutorials, demos, and webinar recordings for hands-on learning
What's New in Oracle Analytics Cloud
Latest feature releases, updates, and enhancements